

Recently, almost everyone in Canada received the federal census document in our mail, and hopefully all did our civic duty to contribute to this important and comprehensive data set that informs much research and policy development. It is also a critical important data source on household, housing costs and conditions and thus in measuring progress in reducing affordable housing need.
The National Housing Strategy (NHS) was released in November 2017 and implemented beginning in April 2018 with federal unilateral initiatives and April 2019 for provincial-territorial cost shared programs under the NHS bilateral agreements (except for Canada Housing Benefit which was scheduled to start in April 2020).
Alongside ancillary objectives to preserve and improve the existing legacy stock of some 600,000 units of social housing, the NHS set out two key goals:
- To reduce affordable housing need among renters by 50% (a reduction of 530,000 households in need); and
- To reduce chronic homelessness by 50% (amended in the Fall Economic Statement to 100%)
The census data does not cover people experiencing homelessness, so let’s focus here on the goal of reducing renter need, which CMHC defines as households below locally prescribed income limits; and living in unsuitable (crowded) housing, homes in need of major repair and spending more than 30% of gross income.
Analysis using the CMHC core housing need methodology reveals that the majority of core need among renters relates to an affordability problem (90% of all renters in need). [1] Accordingly, issues of both income and shelter costs substantially influence need. The two other core need concerns, suitability (crowding) and adequacy (condition) are much less frequent, but can co-exist with affordability issues. Key features of core housing need:
- Housing need is far more extensive and acute among renters than owners – primarily because renter median incomes are less than half those of owners. This underpins the high frequency of affordability problems;
- While renters make up just under one-third of all households, they have consistently accounted for more than two-thirds of households in core housing need. In 1991 renters accounted for 72% of need; by 2016 this had fallen a little but was still 66% of households in core need;
- CMHC measures both the total number of households in need and the incidence of need (renters in need as a proportion of all renters). The incidence rate of need for renters is far higher, over four times higher. In 2016 one in every four (26%) renter households were in need; among owners only one in every 16 (6%) were in need.
Before exploring likely direction and change in need since 2016, that will ultimately be confirmed by the 2021 census data, its useful to review patterns and drivers of need over previous census periods.
As shown in chart 1 below, the core housing need incidence rate for owners has remained consistent over time, even as the total number of owners grew substantially from just under 6 million households in 1991 to over 9 million in 2016. The result is that while incidence remained roughly constant, the absolute count of owners in need rose from 354,000 to 563,000. This reflects the fact that increases in the price of housing has outpaced increases in incomes.

Meanwhile among renters, where need is much more acute, we can see a large jump in need –in both absolute count and incidence — peaking in 1996. This was followed by a gradual decline until 2011, after which both incidence and counts again increased.
Investigating the cause of these trends can provide insight and facilitate some forecasts of likely trend between 2016 and 2021, ahead of the release of the 2021 census.
First the dramatic increase in renter need 1991 to 1996: This coincided with two important influences.
- First a deep economic recession in 1990-91, followed by a very slow recovery in employment and wages. And for low income households on income assistance (a large proportion of renter need) efforts to reduce government deficits by federal and provincial finance ministers, further impacted incomes. Lower incomes exacerbate affordability issues.
- Compounding these income issues, the termination of federal funding for new social housing (emulated by reduced provincial spending in most provinces) and a dramatic decline in both social and private rental starts reduced the new supply of low-moderate rent units.
The result was that renter need peaked at 1.20 million households, representing almost 32% of all renters.
Remarkably though, over the following 5 years 1996-2001, renter need declined by some 109,000 and the incidence rate of core housing need fell back to 28.3%, despite the lack of any new social-affordable housing construction (except a small number in BC and Quebec). Need declined primarily due to a stronger economy with employment and income growth and this more than offset that absence of any new housing assistance.
Perhaps the most important contributor was relative ease of accessing ownership (better incomes plus lower mortgage rates) which saw the ownership rate rise dramatically from 63% (1996) to 68% (2006). This meant that 800,000 renter households were able to purchase a home and thus leave vacancies in the rental sector (softening vacancy rates, despite very low construction) and lowering pressure on rents (and affordability issues).
The federal-provincial-territorial Affordable Housing Framework Agreement in 2001 re-engaged government but with a very modestly funded program that generated a very small number of new affordable rental units – on average less than 7,000 per year, and similarly this had a minimal effect on core need.
So again, the far bigger influence after 2001 was a continuation of strong economic and income growth, with a short pause in 2008-09 due to the global financial crisis, although this had only a small and short impact in Canada.
We then see a very large jump in the number of renters in need in 2011-2016, although the incidence rate increase only marginally.
The fact that the incidence of renter need hardly increased (up from 26.4% to 26.8% after 2011) was a result of the overall number of renters increasing at a faster rate – because, as noted above, erstwhile homebuyers were blocked and remained renters.
The reasons behind an increase in the absolute number of renters in need (from 989,000 to 1.120 million households) back to the 1996 peak level, is less obvious than the explanations of earlier trends. It reflects the combination of modest changes across several fundamentals – minimal affordable supply, modestly rising rent levels, and some slowing in employment and income growth (smaller annual net growth in household disposable income – see chart 3 below) compared to the pre-2011 period. Demographics (more low-moderate income single person households) and migration may also have contributed.
So what will we see in the 2021 census data?
To estimate the likely trend in renter housing need that will be confirmed when the 2021 census data are published (mid 2022) we can look again at the fundamentals – employment, incomes, rental supply and migration.
The post-2015 period has seen a significant increase in new purpose-built rental construction. New rental construction has tripled from under 20,000 per year pre 2016 to over 60,000 in 2020. However, this new construction has not generally created affordable units.

Comparing rents in units completed after 2015 to the average of all pre 2016 purpose built rental in the CMHC rent survey (Chart 2) reveals that rents in newer units are on average 43% above the average market and in some cities, more than 60% higher.
The CMHC Rental Construction Financing Initiative (RCFI), which requires that 20% of units meet a modest affordability criteria may have played a small part, but accounts for less than 5% of total rental starts from April 2017, when implemented, to December 2020. So this generates no potential positive factors to reduce affordable need from new supply.
And low supply is more than offset by the erosion of existing lower rent units. Between 2011-16 the number of units renting below $750 and thus affordable to households with incomes below $30,000 declined nationally by 322,000.
This is caused in part by demolitions to make way for new development associated with an emphasis on intensification in municipal planning and growth strategies. A second and larger factor is financialization. Rental properties have become an attractive asset class and lower rent, more affordable “under-performing” properties are being targeted for acquisition by a range of investors – small investors as well as large capital funds and Real Estate Investment Trusts (REITs). These lower rent properties are being bought and sold at staggering rates. And in larger cities where short-term rentals have been documented as most significant, some existing lower rent units may have been lost to the short-term market (although municipal bylaws are now seeking to manage this issue).
Overall, for these three reasons we expect the rate of the loss of affordable units, which will be revealed in the 2021 census, will be much higher than it was in the 2011-16. And this will negatively impact affordable renter need.
This effect is revealed in Chart 3 below, which identifies a large decline in vacancy rates, corresponding with a very substantial increase in the rate of year-year rent increases (4% in 2018-19). This is weighted aggregate national data – the trends in a number of larger metropolitan markets show deeper dives in vacancies and faster year-to-year rent change (Ottawa for example saw an 8% increase in the average rent 2018-19).

The COVID-19 pandemic provided temporary relief with vacancies turning back upward in 2020 and the rate of year-year rent increase slowing, but at 3.7%, still well above the rate of inflation.
This softening in rental vacancies was associated with reduced rental demand related to minimal international migration and in many cities with substantial student populations the effect of universities closing and delivering courses on-line – so many students did not move to their university city. As the borders and universities re-open this temporary relief will disappear. And increasing targets for international immigration is also likely to fuel demand and further impact vacancies.
But demand for rental also increased as a result of constraints on access to ownership. Influenced both by excessive home prices and reinforced by macro-prudential policy changes that constrained access to and qualification for mortgage credit, it became harder for first time buyers to purchase a home so they remain as renters.
Unlike the 1996-2006 period when shift into owning removed pressure from the rental sector, this now has the opposite effect, retaining and building that pressure. And this was reflected in 2016 with the historic first ever decline in the national rate of home ownership (down from 69% in 2011 to 67.8% in 2016). And most of the macro-prudential policy changes came into effect after 2016, so this impact will be stronger in the post-2016 period.
The final factor is employment and income change. This may create some statistical aberrations in the 2021 census data since the census asks about current housing costs (May 2021), but income in the prior year (2020). The massive scale of wage supplement and support programs has been identified and associated with a large increase in per capita income in 2020. And since incomes change has historically had a larger impact on core housing need this might be the deciding factor.
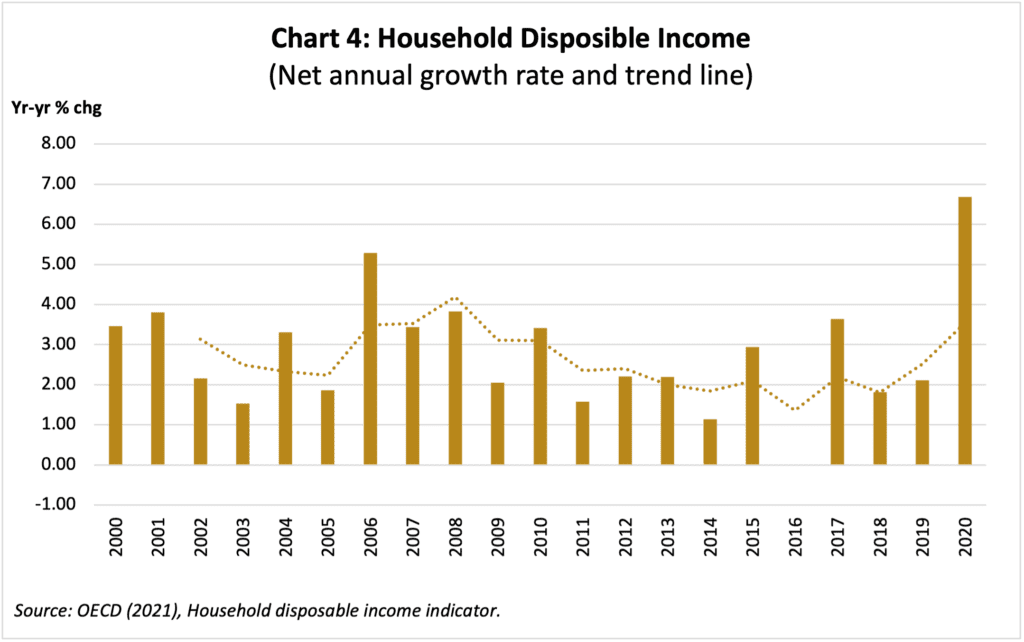
As shown in chart 4, income growth from 2016 to 2019 was modest, on average tracking close to the rate of inflation around 2%; but the wage subsidies in 2020 drastically increased household disposable income. As we saw in earlier periods, income change is a significant factor affecting affordability.
This temporary income boost will have had a positive influence on affordability, assuming the income gains were reasonably distributed and included renters. COVID data have suggested that those in more vulnerable and part time service and hospitality employment and lower wage positions were disproportionately impacted by layoffs and income loss, and as such may be well represented among recipients of the wage subsidy. This is also the population more likely to have been in core housing need, so some may have been lifted out by this income gain.
Conclusion and prediction
Combining all these factors we propose that in the absence of the pandemic and temporary income boost this created, that the number of renters households in core need would have substantially increased between 2016 and 2021, and the NHS goal of a reduction in renter housing need would not have been met.
The effect of the temporary wage boost likely offset the negatives of minimal affordable rental supply (and few housing allowances), erosion of the existing affordable stock, and the substantial and compounding increases in rent levels since 2016.
This will likely mean that while the number of renter households in core need may have not gone up, neither will the number have declined. In short, we will see no discernable progress in meeting one of the two primary goals of the National Housing Strategy – a 50% reduction in renter need.
And because the wage boost is temporary and creates an artificially high level of income in 2020, once incomes revert to their normal basis – earnings and income assistance for those in deep poverty – the new base number in need in 2022 will be higher.
Consequently, the next census period will be counting from well behind the starting line and therefore face a greater challenge in catching up with the goal (50% reduction and a decline in renter need of 530,000 households) by 2026.
The government, which should be held accountable for progress (or lack thereof) in achieving progress under the NHS, may have temporary immunity from the underlying fundamentals of rental housing affordability in the 2021 census data, thanks to COVID-19 emergency income supports raising the income denominator in 2020. But the bigger challenge will be to get back on track and to accelerate progress between 2021 and 2026, the next milestone in assessing progress.
[1] Some may also experience additional problem of crowding or poor condition – especially lone parents that may not be able to afford a suitably sized unit.
Very informative and possibly prescient. As Developers, we also look over the horizon and are addressing the lack of affordable rental housing for the Forgotten Middle Boomer generation through ‘Compassionate Capitalism’..
http://www.myjoyliving.com